Door Wouter Martens op 9 Jan, 2025

Isn’t it amazing how our brains are absolute rockstars at decoding visual cues? Inside our brain sight has the highest available bandwidth of all the senses. It’s the sensory equivalent of a high-speed internet connection, and in this blog (the second in my Visual Analytics series), we’re diving into why that is and what’s happening behind the scenes when we process visual information.

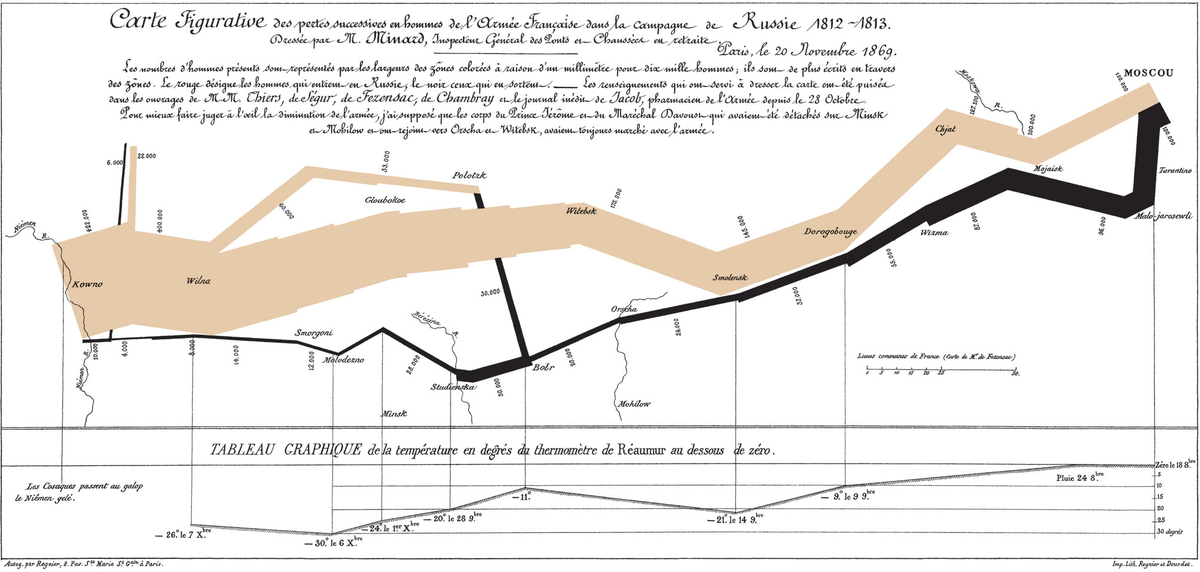
To create effective visualizations, we need to understand how our brain handles visual input. Tor Norretranders showed that vision dominates human sensory bandwidth by a landslide (as shown in the graph above). It’s our biggest contributor to making sense of the world around us.
How does it work inside the brain?
Here’s how it works: when a visual stimulus enters your eyes, it’s routed to the brain for processing. First stop? The thalamus, which acts like a traffic cop, organizing the data and sending it to the primary visual cortex. This is where the basics—edges, orientation, motion, depth—get sorted. From there, the info is passed along to secondary visual areas, where texture, shape, and color come into play. At this point, the brain takes the scenic route via two processing streams: the “where” stream (dorsal) and the “what” stream (ventral).
In just milliseconds, this visual symphony unfolds—completely outside your conscious awareness. Once processed, the brain’s memory system kicks in to determine what sticks. Here’s the breakdown:
- Iconic Memory: Think of it as your brain’s screenshot tool, holding visual input for a blink-and-you’ll-miss-it moment (less than a second). This brief buffer decides if something’s worth passing to working memory.
- Working Memory: This is where the magic happens—holding and juggling visual info for immediate use (a few seconds to minutes). It’s how you solve puzzles, make decisions, or map out your route to the coffee machine.
- Long-Term Memory: The deep storage vault for visual info, where faces, objects, and scenes live rent-free for years.
The first stage, iconic memory, is where visual stimuli can really sway us. A savvy data visualizer knows how to grab your attention with pre-attentive processing—those split-second visuals that your brain absorbs before you even realize it. By leveraging this step, skilled designers can make data visualizations not just informative but effortless to understand.
In the next blog, I’ll dive deeper into pre-attentive processing and how it helps turn data into stories your brain can’t resist. Stay tuned!
At the Information Lab we can provide training in your Visualization Journey. The trainings we provide are in all aspects of working with data and visualizing it using different tools. If you need more information please contact us through info@theinformationlab.nl or our contact form