- Solutions
- Technology
- Sigma
Sigma
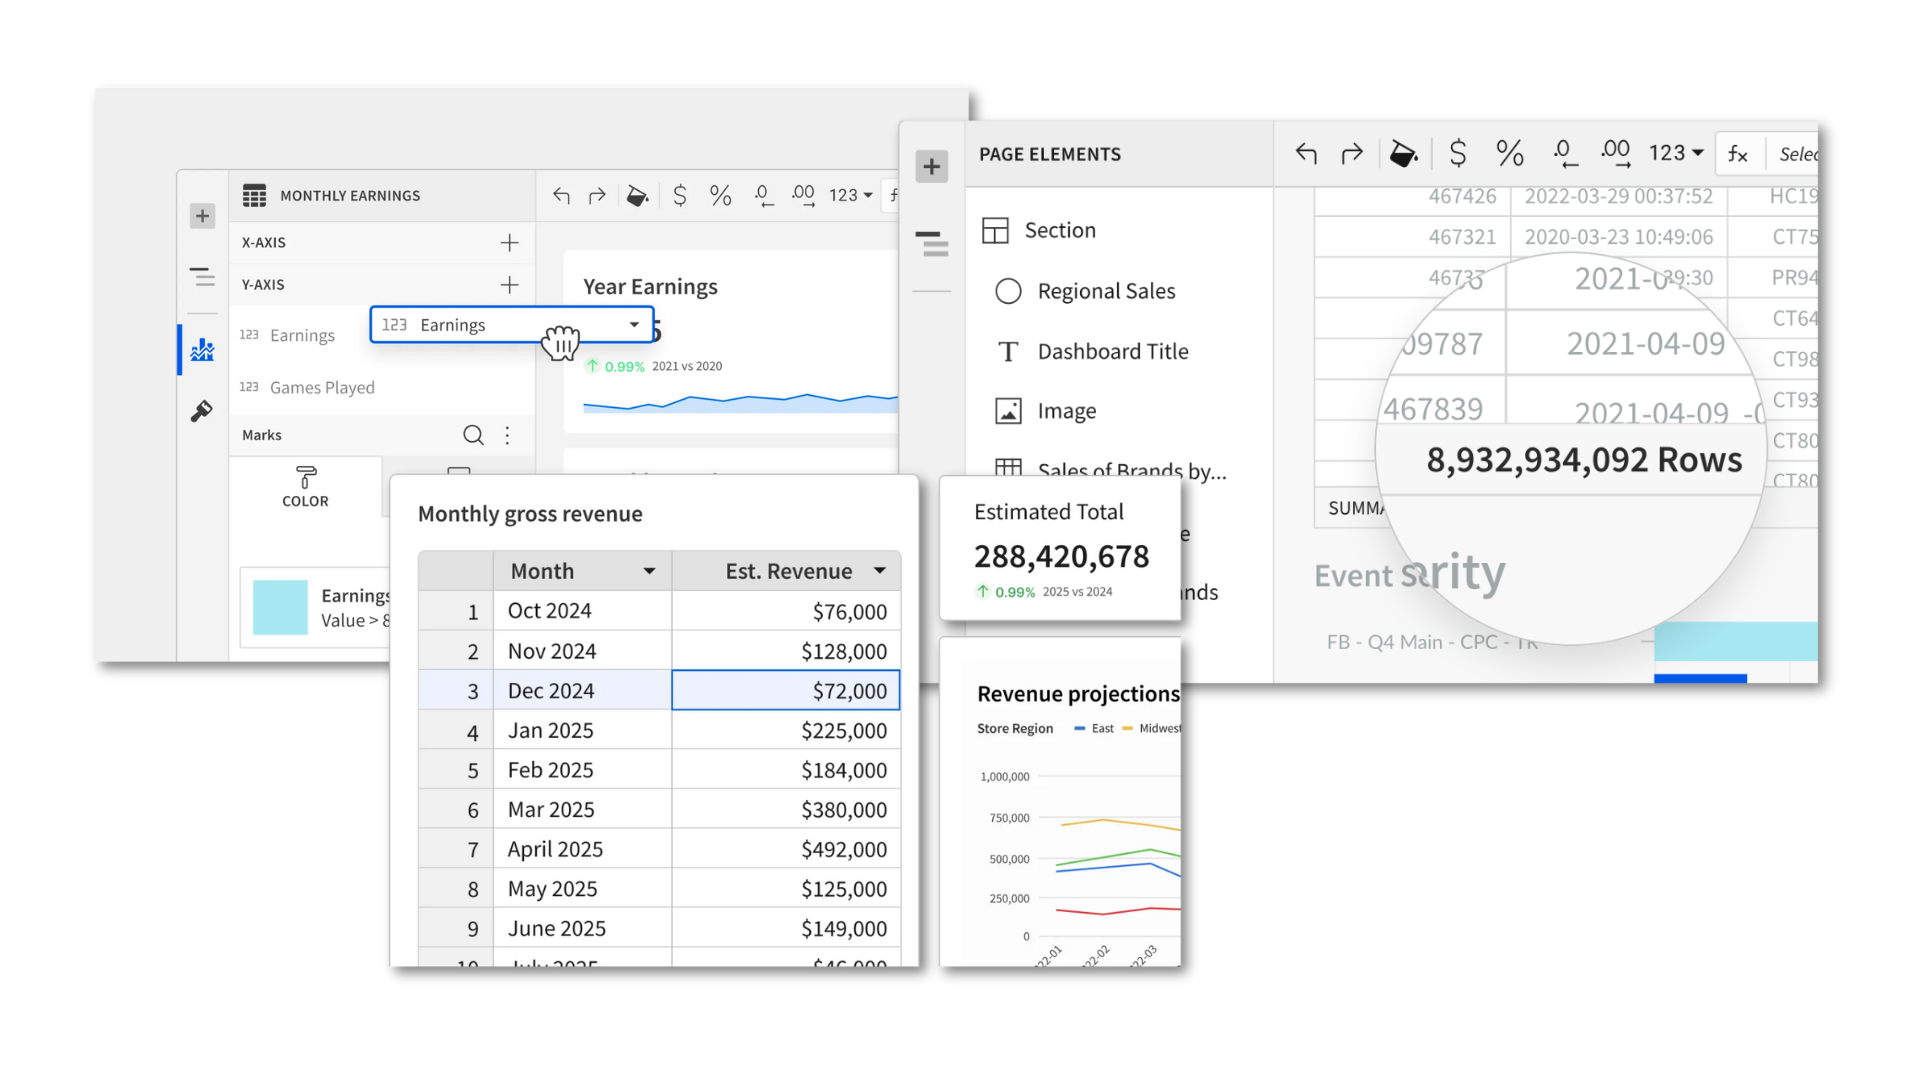
Sigma Computing is a business intelligence (BI) and analytics platform built specifically for the modern cloud. Unlike traditional tools, Sigma enables business users to explore and analyze live data with the familiarity of a spreadsheet, without the need for SQL knowledge. It combines the power of your Cloud Data Warehouse with the simplicity of Excel.
Our Experience with Sigma
As a Sigma Computing partner, we help organisations bridge the gap between data and decision-making. Our consultants don't just handle the technical setup — they focus on driving adoption across your organisation.
Technical Setup
Full implementation and configuration of the Sigma platform within your data environment.
Sigma Apps & Input Tables
Building interactive data apps with write-back to the warehouse, for scenarios and planning.
Organisational Adoption
Ensuring colleagues use Sigma effectively and enthusiastically.
Strategic Partnership
Expert advice on how to deploy Sigma across your organisation.
Advantages
Spreadsheet interface for everyone
Sigma's interface feels like a spreadsheet. This allows domain experts (marketing, finance, sales) to run their own analyses without knocking on the data team's door for every report.
Direct connection to the Data Warehouse
Sigma does not copy or move data. The tool looks "live" into your cloud data warehouse (such as Snowflake, Databricks or BigQuery). This means that reports are always real-time and there are no security risks from data extractions lying around.
Security and Governance
Because the data never leaves the cloud environment, all data warehouse security rules remain in place. IT maintains control while the business gains freedom.
Scalability
Whether millions or billions of rows; because Sigma uses the computing power of the cloud, analyses are lightning fast.
Tableau
What is Tableau?
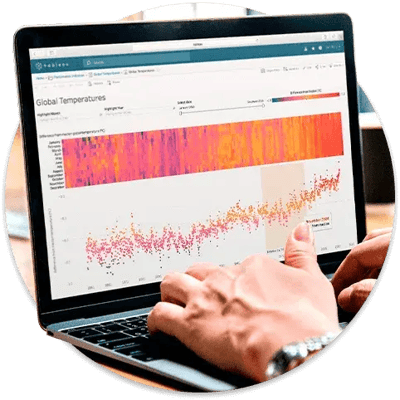
Tableau is one of the most popular tools for data visualization. With Tableau, you turn raw data into interactive dashboards and reports that everyone in your organization can understand. Whether you want to create an overview of KPIs, analyze trends or share insights with colleagues - Tableau makes data accessible.