Sigma vs. Tableau vs. Power BI: Which BI Platform Is Right for Your Business?
By Emre Oktay on 3 Jul, 2026
Choosing a business intelligence platform is one of the most consequential data decisions a company makes. Get it right, and every team from finance to marketing gains fast, trustworthy access to insight. Get it wrong, and you end up with stale dashboards, and analysts drowning in report requests.
Three platforms dominate the conversations we have with clients: Tableau, Microsoft Power BI, and the newer cloud native challenger, Sigma Computing. Each takes a fundamentally different approach to architecture, ease of use, and cost and the "best" choice depends heavily on your existing data stack and who in your organisation needs to use it.
Here's how they stack up.
The short version
Architecture: where the compute actually happens
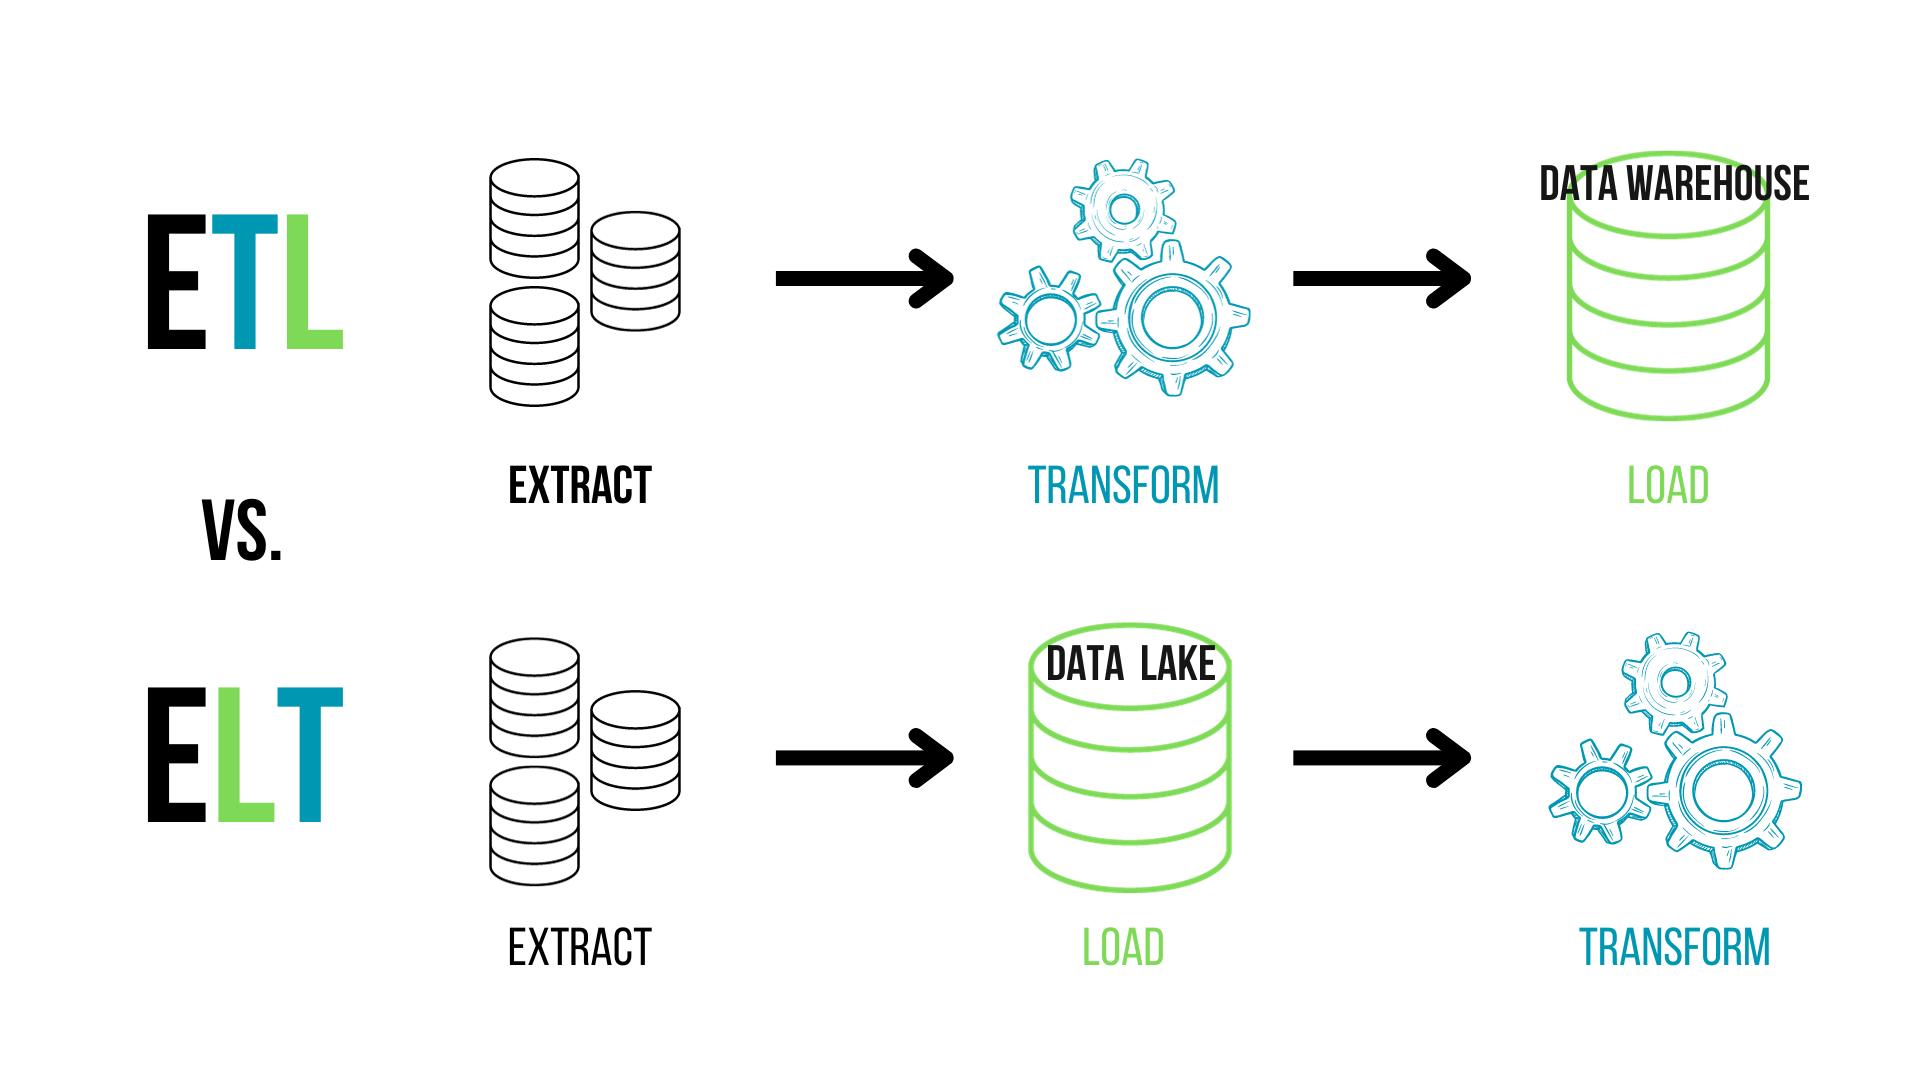
Sigma queries billions of rows quickly by pushing processing down into the cloud data warehouse itself — leveraging engines like Snowflake's MPP, so it stays fast as data scales without needing to extract data out. Tableau and Power BI, by contrast, often rely on data extracts, which require extra compute or pre-aggregation to stay performant, at the cost of data freshness and added complexity.
That's not a knock on extracts as a concept. They're genuinely useful for development work and for use cases where data only needs to refresh on a schedule, since you avoid continuously re-running live queries. But extracts can also introduce stale or duplicated data, longer refresh queues, and governance headaches once reports are being run locally outside a central schedule.
Tableau leans on its in-memory Hyper engine, which is well optimized for CPU and memory and handles complex queries capably but at large enough scale, teams eventually have to start aggregating, sampling data, or scaling up servers.
Power BI takes yet another approach: it generates a fresh query for each individual visual, which guarantees real-time results but can introduce noticeable latency, especially as dashboards get more complex. Worth noting for teams evaluating Power BI's DirectQuery mode specifically: performance drops off more sharply once you cross roughly a million rows, and DirectQuery queries are capped at that row limit.
Sigma's advantage here is real, but it comes with a tradeoff worth flagging: Sigma is cloud-first and cloud-only. It doesn't import data at all, connecting directly and exclusively to warehouses like BigQuery or Snowflake in real time. If a chunk of your data still lives outside a modern cloud warehouse, that's a real constraint.
Ease of use: analyst tool vs. business user tool
This is where the three platforms diverge most in terms of who they're actually built for.
Tableau rewards expertise. It's often described as the Photoshop of data, extremely powerful once mastered, capable of stunning interactive visuals, but with a real learning curve, and even basic dashboards can be tricky for people who aren't dedicated analysts.
Power BI sits in the middle, especially for anyone already comfortable with Excel-style logic and the broader Microsoft stack, though its more advanced modeling (DAX, star schemas) still has a learning curve of its own.
Sigma is explicitly built for business users first. It feels like using Google Sheets or Excel cells, formulas, filters. Except you might be working with millions or billions of rows instead of ten thousand, so business users don't have to learn an entirely new interface. Sigma's spreadsheet-like interface is genuinely appealing to teams that want to empower non-technical staff to explore data without a steep learning curve. That said, ease of use has a ceiling: some users report outgrowing Sigma's capabilities once their analysis needs get more complex, and its customization options are less extensive than more mature platforms.
Collaboration and governance
Sigma feels closer to Google Docs than a traditional BI tool. Multiple people can work on the same report simultaneously, sharing is as simple as sending a link, and row-level access controls let you restrict, say, a department manager to only their own data. More broadly, all three platforms now support meaningful row-level and role-based security, though the granularity and ease of configuration varies.
On the governance side, Power BI and Tableau both offer more mature options for maintaining a single, consistent version of the truth across an organisation: Power BI's shared datasets and data flows, and Tableau's published data sources, let teams reuse a governed data model without having to recreate joins or transformations every time. Sigma's live-query model is a strength for freshness, but it comes with a modelling quirk: Sigma requires creating a new dataset for each join, which can lead to fragmented data models, and when underlying datasets change, visuals often need to be manually repointed.
Ecosystem and vendor lock-in
Where a platform sits in a larger vendor ecosystem matters more than it might first appear.
Tableau is increasingly tied into the Salesforce ecosystem, while Power BI is evolving into a broader web of Microsoft Fabric, OneLake, and the Power Platform. There are real upsides to that depth of integration if you're already committed to Salesforce or Microsoft. But also real downsides in the form of vendor lock-in and, for some organisation, a ceiling on ROI outside that ecosystem. Sigma's pitch is the opposite: as a cloud-native tool with no parent-platform allegiance, it can flex its compute and storage directly with your warehouse as demand changes, rather than requiring more complex on-prem-style scaling.
Pricing
Pricing is one of the clearest practical differentiators:
- Power BI is by far the cheapest entry point, which is a major reason it has become the default choice for organisations already paying for Microsoft 365. List pricing sits around $10 per user per month, with additional cost for Premium/Fabric capacity at scale.
- Tableau costs considerably more. Its Creator license runs around $70 per user, noticeably higher than Power BI or Qlik Sense, though organisations typically need only a handful of full Creator seats alongside a larger number of cheaper Explorer and Viewer licenses.
- Sigma doesn't publish pricing at all. There's no public price list. Cost appears to depend on user count and data volume, and you'll need to talk to their sales team to get a number. Buyers should also factor in that Sigma's live-query architecture means your data warehouse compute bill (Snowflake, BigQuery, Redshift credits) becomes part of your effective BI cost, even though it isn't a line item on Sigma's own invoice.
The bottom line
There's no universal winner here. Only the right fit for your data stack, your team's technical depth, and your budget. Many of the organisations we work with actually end up running two of these tools side by side: Power BI or Tableau for polished, governed executive reporting, and Sigma for fast, ad-hoc exploration by business teams. If you're not sure which combination makes sense for your environment, that's exactly the kind of assessment our team can help you work through.
Want help evaluating which BI platforms fits your data infrastructure? Get in touch with us to talk through your specific requirements.
You May Also Like
These Related Stories
The role of Analytics Engineers in Modern Data Teams

Working with AWS in VS Code