


BI & Analytics
We transform data into smart insights that help you move forward. With intuitive dashboards and analytics, we empower the people in your organization to make better decisions.

Data Engineering
We lay the foundation for your data-driven organization. We transform raw data streams into a structured architecture. With robust pipelines, we create a single source of truth.

Training
Do you really want to get more out of your data? Our practical training courses give you the skills to analyze and visualize data independently. Boost your confidence and make an immediate impact with better insights.

Support
Want certainty about your data environment? With our support and managed services, we guarantee continuity. Rely on our technical expertise and focus entirely on making an impact.
Data Sources
Databases
(SQL/NoSQL)
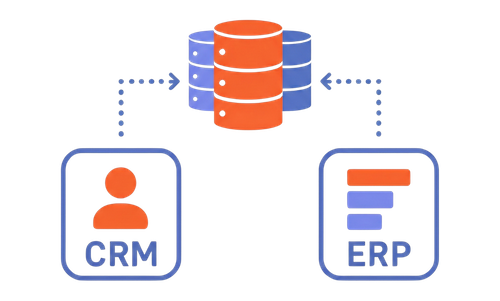
Applications
(CRM, ERP, Finance)
Centralize data from your critical business systems (such as Salesforce, HubSpot Exact or AFAS) in one place. This can be done, for example, via our own Exact Online Connector.
Cloud Services
(API, IoT)
Integrate external data streams, API links and IoT sensor data for real-time insights.
.png)
Files
(CSV, XLSX, JSON)
Automate the import of individual files. No more manual work with Excel sheets.
Data Transformation & Data Warehouse
Snowflake is our first choice because of its scalability and ease of use. However, are you working with Databricks or Google BigQuery? No problem, our engineers have experience with those as well.
Bronze
Raw Data Ingestion
Automated ELT pipelines (e.g., via Fivetran, Airbyte or Python scripts) load raw data directly into the Data Warehouse without loss of history. This then forms the source layer: an exact copy of the source. Essential for history and auditability.
Silver
Cleaned & Harmonized
The quality layer: data is deduplicated, cleaned and standardized into one truth.
Gold
Aggregated & Ready to use
The business layer (also called serving layer): data enriched with your business rules and KPIs, ready to use in dashboards, AI models and other applications.
Supporting Tools & Processes
These are our preferred tools. But we adapt to whatever fits your organization best.
Data Transformation & Testing
Ensures transparent data models and guarantees data quality through automated testing.
We can also work with low-code platforms such as Alteryx, Matillion and Coalesce - for faster development and better adoption by business-focused teams.
Version Control & CI/CD
Provides version control and security: changes to your data environment are always traceable and reversible.

Orchestration & Planning
The conductor of your data: makes sure all the streams are running at the right time so your reports are ready in the morning.
This could also be done with tools such as Dagster or Prefect.
Analytics & Reporting
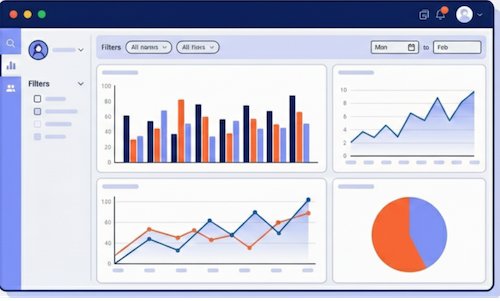
Interactive dashboards & Visualizations
Turn data into action with clear, interactive dashboards
For example, in:
-
Tableau
-
Sigma
-
PowerBI
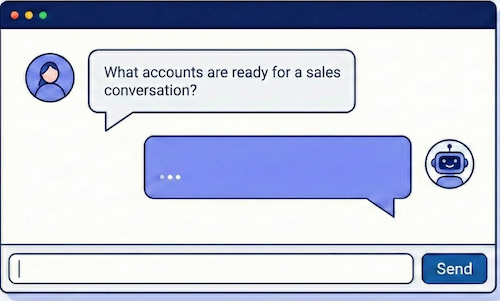
Conversational Analytics & AI
Make data accessible to everyone: ask questions to your database in plain language via AI. For example, via our InsightsAI.
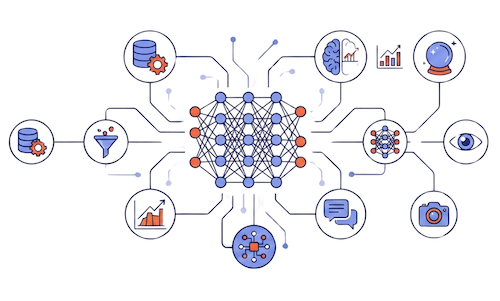
Advanced analytics, Machine Learning & Reverse ETL
Look ahead: use Machine Learning to predict trends and optimize processes.
And place enriched data back into your source systems with Reverse ETL.


.jpeg?width=300&height=323&name=cordaan-foto%20(1).jpeg)
.png?width=300&height=300&name=Bol-Logo%20(1).png)

Different Types of Bar Charts and Use Cases
Bar charts (or bar graphs) are considered one of the most common ways to communicate data through visualizations. They are used for plotting categoric…
Sigma vs. Tableau: My First Weeks Moving Between Two Worlds
We recently made the decision to bring Sigma into our ‘best-of-class’ toolkit, and as a long-time Tableau user, I’ve spent the last few weeks really g…

Tableau: When to INCLUDE, When to EXCLUDE, When to FIXED
Tableau, a powerful data visualization tool, offers a variety of features that empower users to gain insights from their data. One such feature is Lev…